Evaluation of SEM-EDS Particle Count Statistics
August 29, 2017
Considerations with QEMSCAN Grain Size Estimation
November 7, 2017

In last week’s article we spent some time evaluating particle statistics using SEM-EDS data to demonstrate the importance of the number of particles measured. As I analysed and plotted the data it dawned on me just how critical sample preparation really is. Of course we know that sample preparation is important. It is fairly intuitive that the particle population has to be distributed and oriented randomly within the sample block volume and the exposed block section to achieve a representative result, but this was the first time I could visualise why. In this article we will spend some time evaluating the implications of non-random particle distributions and the practical implications of the number of particles measured.
The figure above demonstrates a hypothetical scenario where quartz is distributed non-randomly in the exposed sample block surface. In this case we assume that the measurement starts in the top left corner of the block and works its way down to the bottom right corner. As the measurement continues from one field of view to the next the cumulative data includes some proportion of quartz, which initially fluctuates with high frequency because of the low number of data points in the early stages of the measurement. As more data are accumulated the quartz proportion ‘stabilises’, until it reaches the region highlighted in the black circle. This region represents a high concentration of quartz relative to the other phases, which causes a sudden increase in the amount of quartz in the result and an associated decrease in the proportions of other phases. The problem of non-random particle distribution is conflated by the fact that we have to decide on some measurement termination criteria, e.g.: number of particles, number of fields, or measurement time. In this example, if we choose to terminate the measurement at, for example, 3000 particles, then quartz is likely to be underrepresented. If we continue to measure all ~6000 particles then it can be argued that we are indeed capturing all mineral occurrences, implying that the result is representative of the section. However, the results for this section, regardless of the termination point will be non-representative of the sample because of the non-random particle distribution. Operations such as the stereological corrections for mineral and particle properties like grain size and liberation assume random particle distributions and will not be valid in this example. For further reading I recommend the publications of Leigh, Lyman, and Gottlieb (1996) and Spencer and Sutherland (2000), in which the authors explore the correction of stereological bias in liberation analysis.
Sample preparation and the number of particles measured are fundamental to data integrity. SEM-EDS operators have the responsibility of selecting an appropriate measurement termination criteria, which, as we demonstrate above, can influence the results. In the article on evaluating particle statistics I mentioned that we would explore methods for terminating measurements based on statistics, rather than a pre-determined number of particles or measurement time. I spent a few days experimenting with mathematical methods to identify a termination point based on cumulative mineral proportion data. Figure 1 shows the cumulative quartz proportions for a real measurement. The mathematical procedure I developed computes the measurement termination threshold at 1992 particles. In reality we measured ~6000 particles in this sample, but we could have comfortably measured only 30% of the total number of particles to achieve practically the same result in almost a third of the time. Such optimisations are essential for time-critical data such as those generated in operational mineralogy. The threshold value of 1992 particles was computed by investigating the rate of change (gradient) of the cumulative standard deviation of quartz.

Fig 1. Showing the theoretical measurement termination point at 1992 particles as a function of the gradient of the quartz standard deviation.
The next question is whether or not the mineral used for termination analysis has an effect on the overall mineralogy result. Figure 2 shows the sample bulk mineralogy as a function of the number of particles as determined using each mineral in the sample. The data show that the overall mineralogy remains relatively consistent regardless of the mineral used to identify the number of particles required. I was particularly surprised to see that even when using the termination threshold based on minor minerals such as zircon or muscovite, which also return the lowest number of particles required, the results are similar compared to when terminating based on the major phases. We can also see that the results from any of the number of particles identified for measurement termination is similar to the actual result for the sample based on ~6000 particles (semicircles on the left of the plot).
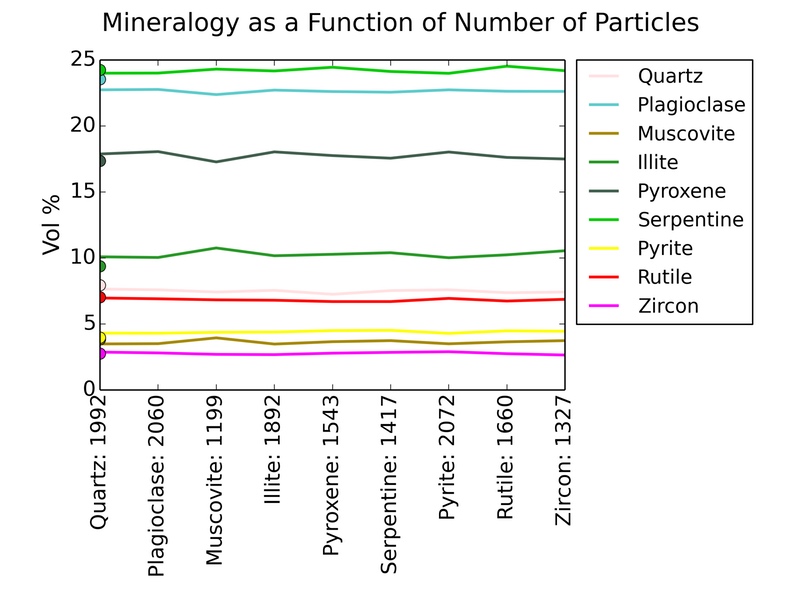
Fig 2. The bulk mineralogy of the sample as a function of the number of particles based on the gradient of the standard deviation of each mineral in the sample. For example, with zircon as the mineral reference to determine when to terminate the measurement the number of particles required for a ‘stable’ result is 1327. The semi-circles on the left show the results based on the ~6000 particles in this measurement.
The example analysis method I show here is clearly not implemented in any existing SEM-EDS system, however, Zeiss Mineralogic has a measurement termination option based on statistics, which I would venture has the potential to save measurement time and ensure statistically representative data. A slightly less tangible, yet valuable benefit of a statistical method is the additional confidence we as users would have in our data. As for the impact of sample preparation, even if we used statistics to terminate measurements, poorly prepared samples would still produce questionable results and the only way to prevent that is to ensure that we follow strict sample preparation guidelines to minimise the potential impact of non-random particle distributions.
The assessment of sample preparation and particle statistics are part of the MinAssist data validation service. Contact us if you have data you would like us to check, or if you would like to start a conversation about sample preparation, measurement techniques, and data quality.
References: